

Non-Thermal 635nm Low-Level Laser Therapy in Pre-Diabetes and Obesity Management
Background
Pre-Diabetes and pre-obesity often go hand in hand. Diabetes mellitus (DM) is a chronic condition that can alter our carbohydrate, protein, and fat metabolism. It is caused by the absence of insulin secretion due to either the progressive or marked inability of the β-Langerhans islet cells of the pancreas to produce insulin, or due to defects in insulin uptake in the peripheral tissue. DM is broadly classified under two categories, which include type 1 and type 2 diabetes.
Body mass index has a strong relationship to diabetes and insulin resistance. In obese individuals, the amount of non-esterified fatty acids (NEFA), glycerol, hormones, cytokines, proinflammatory markers, and other substances that are involved in the development of insulin resistance, is increased.
The pathogenesis in the development of diabetes is due to the β-islet cells of the pancreas becoming impaired, causing a lack of control of blood glucose. The development of diabetes becomes more inevitable if the failure of β-islet cells of the pancreas is accompanied by insulin resistance. Weight gain and body mass are central to the formation and rising incidence of type 1 and type 2 diabetes.
In conclusion, new approaches in managing and preventing diabetes in obese individuals must be studied and investigated based on the facts. True Non-Thermal Low-Level Laser (TNTLLL)may form part of the solution.
The association between type 1 diabetes and weight gain was first investigated by Baum et al in 1975. The Baum et al study suggested that there was an association related to overfeeding or to hormonal dysregulation.
Overweight and obesity are defined by an excess accumulation of adipose tissue which impairs both physical and psychosocial health and well-being. Obesity is considered a health disaster in both developed and developing countries.
The increased prevalence of obesity in the current climate has drawn attention to the worldwide significance of this problem. In the US, approximately two-thirds of the adult population is overweight or obese and similar trends are being noticed worldwide. Obesity is linked to many medical, psychological, and social conditions, the most devastating of which may be type 2 diabetes. At the start of this century, 171 million people were estimated to have type 2 diabetes, and this figure is expected to increase to 360 million by 2030. The figures from the World Health Organisation show that around 422 million people worldwide have diabetes, with the majority living in low-and middle-income countries, and 1.6 million deaths are directly attributed to diabetes each year. Both the number of cases and the prevalence of diabetes have been steadily increasing over the past few decades. A comparison of the two sets of statistics shows just what a combined problem these two conditions represent. The Pharmacoeconomics, not to mention the associated costs on health services is staggering. In 2016 the estimated burden of diabetes on healthcare infrastructure was 825 Billion USD. There are no published figures for 2020, but it is estimated to be more than a trillion USD.
The Study
The study enrolled 140 men and women between the ages of 18 to 70 with a body mass index (BMI) of 27 to 45. This was a 24 month study including follow up. Participating subjects were randomised in a double-blind fashion to receive non-thermal low-level laser. The study was set up as below.
Non-esterified fatty acids (NEFA) are molecules released from triglycerides by the action of the enzyme lipase and are transported in the blood bound to albumin. They contribute only a small proportion of the body’s fat; however, provide a large part of the body’s energy. Measurement of NEFA is important in diabetes where insulin deficiency results in the metabolism of fat. Levels are also frequently increased in obese patients.
Subject sample
| Active Subjects | Placebo Subjects | Total Subjects |
| 70 | 70 | 140 |
Subject demographics
Gender
| Group | Male | Female | Total |
| Active | 35 (50%) | 35 (50%) | 70 (50%) |
| Placebo | 37 (53%) | 33 (47%) | 70 (50%) |
Age
| Group | Active | Placebo | Total |
| Mean | 50.13 | 49.24 | 49.69 |
| SD | 9.78 | 9.78 | 9.76 |
| Range | 35 – 65 | 33 – 70 | 33 – 70 |
A t-test for independent samples reported a difference of 0.89 years between randomized subjects to the active and placebo treatment groups to be not statistically significant (t=+0.54, p=0.59; p>0.05).
All subjects involved in this study were recommended and referred by their medical team and had to be pre-diabetic and pre-obese or obese and not taking medication for these conditions.
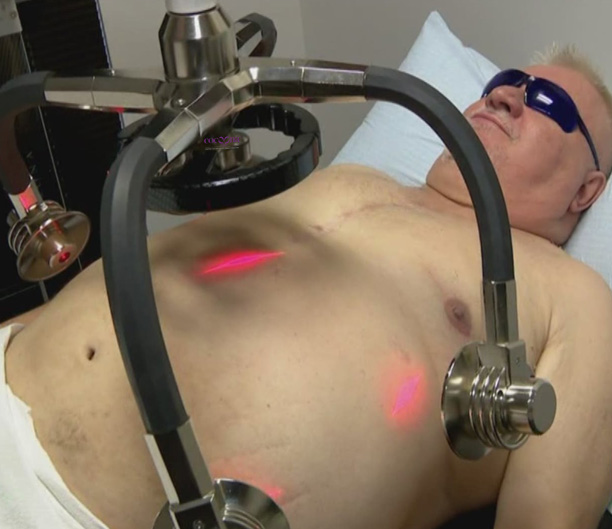
Treatment device.
The low-level laser energy device is a non-invasive dermatological aesthetic treatment cleared by the FDA for use as a non-invasive aesthetic dermatological treatment for reducing the circumference of hips, waist, and thighs and is manufactured by Erchonia Corporation, USA. The LLLT device consists of four independent diodes that are positioned 120 degrees apart and tilted at a 30-degree angle. A fifth diode is positioned at the centreline.
The 17mW of red 635nm of laser light emitted from each diode is collected and processed through a proprietary lens that redirects the beam with a line refractor. The refracted light from each diode is bent into a random spiralling circle pattern that is independent of the other diodes. These overlapping patterns ensure total coverage of the target treatment area. The total amount of energy delivered to the skin during each treatment as stated in the FDA clearance was 3.94J/cm2. Evidence however suggests that this is not relevant as the laser delivers photonic energy via electromagnetic energy transfer.
Procedure.
Each subject was randomised to receive 20 active or sham treatments 2 per week, equally spaced apart with the low-level energy laser device over a 10 week period. Both the active and sham devices have the same physical appearance and emit light when activated that is indistinguishable to both the subject and the administration investigator. All subjects had moderated exercise sessions after each treatment, and another on a day of their choice. Nutritional plans were also moderated for compliance.
Study assessments.
The circumference of each participant was measured using a flexible tape measure pre- and post- each application at 3 points; the base of the circumference at sternum, the circumference at the umbilicus, and again at the trochanter. For accuracy at remeasuring post treatment, a skin marker was used under the tape at several points so the measurements were duplicated. These points were recorded at baseline to ensure that subsequent measurements were obtained at the same location. All measurements were performed by a member of the investigative team not involved in performing the actual treatments. All subjects were photographed from front, sides and back with hands on head.
The primary outcome measure was the number of subjects accumulated BMI and the total decrease achieved. Individually the three combined measurement points after each session were recorded. Blood glucose was also measured each week along with weight and other
variables such as sleep quality and energy levels. Secondary outcomes assessed at the completion of the study included changes in BMI, associated diabetes risk, obesity levels and several subjective ratings, which measured subject attitudes about overall satisfaction with their results and improvements in the appearance.
All study assessments were performed at baseline, at the completion of treatment, and two weeks post-treatment. Following the baseline physical examination, a blinded investigator noted any changes in existing skin condition including scars, cellulite, stretch marks, discoloration, stria, dimpling, skin quality and elasticity following treatment. Details about food and drink consumption, physical activity, and adverse events for each subject were recorded daily. Further follow ups were recorded every 12 weeks primarily for the first 18 months from inception, then extended over the 5 year period. The study is now concluded.
Ethics.
The protocol used in this study adhered to the Good Clinical Practice guidelines and was approved by the local ethics committee in April 2015. The study was overseen by colleagues in the diabetes assessment unit at the local university hospital. Informed written consent was obtained from each subject prior to participation in any study-related activities.
Laser Diode Placement
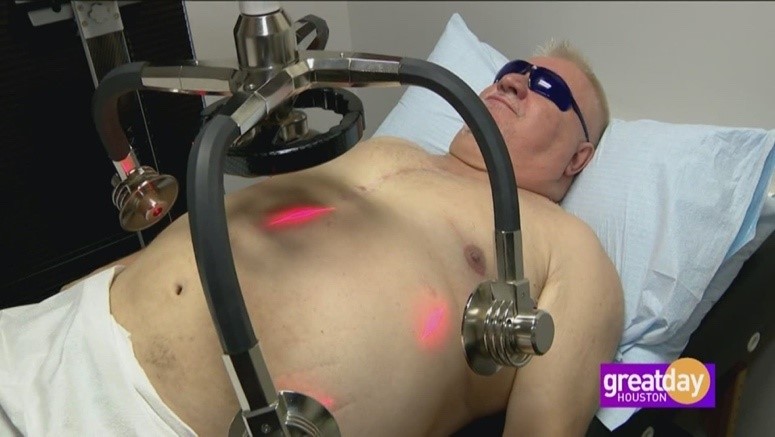
The diodes are placed over the lateral flanks and around the umbilical area. The treatment was performed for 20 minutes and is repeated for a further 20 minutes, with the participant repositioned. A more comfortable method for a heavier subject is for them to lay on their side and the diodes positioned accordingly to cover half of the midsection, the subject then repositions to the other side.
Rational
To find an alternative to the current interventions for diabetes, obesity and associated conditions, to reduce the overall economic burden, and to improve quality outcomes and quality of life for sufferers.
Baseline variables
BMI
| Group | Active | Placebo | Total |
| Mean | 5.09 | 5.62 | 5.35 |
| SD | 1.65 | 1.80 | 1.74 |
| Range | 3.1 – 8.8 | 3.1 – 9.1 | 3.1 – 9.1 |
A t-test of independent samples found the 0.53 difference in baseline Total Cholesterol between subjects randomized to the active and placebo treatment groups to be not statistically significant (t=-1.82, p=0.071; p>0.05).
Throughout the study all participants had their blood pressure, cholesterol and blood sugars monitored. Changes in behaviour were also considered as was sleep patterns, changes in energy levels and general skin appearance. A glycated haemoglobin test (HbA1c) was taken every 12 weeks.
Total Cholesterol
| Group | Active | Placebo | Total |
| Mean | 5.09 | 5.62 | 5.35 |
| SD | 1.65 | 1.80 | 1.74 |
| Range | 3.1 – 8.8 | 3.1 – 9.1 | 3.1 – 9.1 |
A t-test for independent samples found the 0.53 difference in baseline Total Cholesterol between subjects randomized to the active and placebo treatment groups to be not statistically significant (t=-1.82, p=0.071; p>0.05).
HbA1c
| Group | Active | Placebo | Total |
| Mean | 6.46 | 6.46 | 6.86 |
| SD | 0.18 | 0.16 | 4.70 |
| Range | 5.52 – 6.66 | 5.2 – 6.61 | 5.2 – 6.66 |
There is no difference (0 points) in baseline HbA1c between subjects randomized to the active and placebo treatment groups.
Comparisons across evaluations
The following evaluations of study variables were made:
- Baseline (pre-treatment)
- End of Treatment
- Follow-up
The following analyses evaluate the change in evaluations for each study measure across the three evaluations, as applicable.
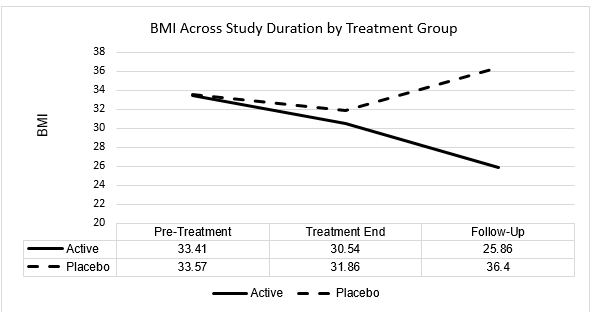
BMI
| BMI | Baseline | Treatment End | Follow-Up |
| Active Mean | 33.41 | 30.54 | 25.86 |
| SD | 2.67 | 2.35 | 1.39 |
| Placebo Mean | 33.57 | 31.86 | 36.40 |
| SD | 3.16 | 3.12 | 1.86 |
As this is a simple inhouse study, the information shared would benefit from more testing within a full RTC. The lead researcher and his team maintained strict protocols throughout this study (see appendix 1).
A one-way ANOVAs for 3 correlated samples was conducted to evaluate change in BMI across the study duration within each of the active and placebo treatment groups, with results as follows:
Active Group
There is a statistically significant difference in BMI ratings across the study evaluation duration for active group subjects (F=563.65, p<0.001). Subsequent Tukey Analysis revealed the statistically significant differences to have occurred between the following evaluations, at p<0.01:
- Baseline to Treatment End
- Baseline to Follow-Up
- Treatment End to Follow-Up
Placebo Group
There is a statistically significant difference in BMI ratings across study evaluation duration for placebo group subjects (F=93.71, p<0.001). Subsequent Tukey Analysis revealed the statistically significant differences to have occurred between the following evaluations, at p<0.01:
- Baseline to Treatment End
- Baseline to Follow-Up
- Treatment End to Follow-Up
In summary, both active and placebo subject groups evidenced a statistically significant decrease in BMI from pre-treatment to treatment end evaluation. However, while both groups likewise evidenced statistically significant changes in BMI from treatment end to follow-up evaluation, this change was in the direction of a statistically significant mean decrease for active group subjects and a statistically significant mean increase for placebo group subjects. By follow-up evaluation, active group subjects evidenced a mean decrease in BMI of 7.55. In contrast, placebo group subjects evidenced a mean increase in BMI of 2.83 across the same evaluation period.
Furthermore, while a t-test for independent samples found a 0.16 difference in baseline (pre-treatment) BMI between active and placebo subject groups to be not statistically significant (p>0.05), the 10.54 difference in BMI between active and placebo groups at follow-up evaluation was seen as statistically significant (p<0.0001).
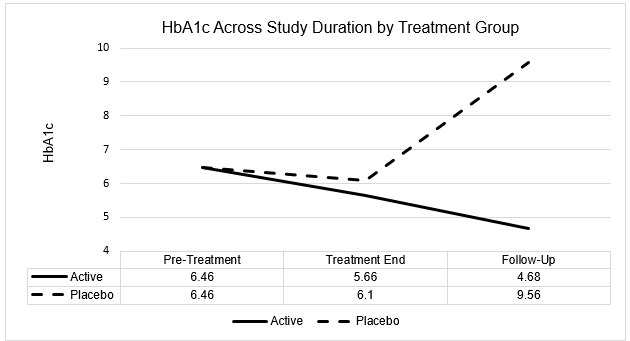
HbA1c
| HbA1c | Baseline | Treatment End | Follow-Up |
| Active Mean | 6.46 | 5.66 | 4.68 |
| SD | 0.18 | 0.20 | 0.40 |
| Placebo Mean | 6.46 | 6.10 | 9.56 |
| SD | 0.16 | 0.26 | 1.67 |
A one-way ANOVA for 3 correlated samples was conducted to evaluate change in HbA1c across study duration within each of the active and placebo treatment groups, with results as follows:
Active Group: There is a statistically significant difference in HbA1c ratings across study evaluation duration for active group subjects (F=797.77, p<0.0001). Subsequent Tukey Analysis revealed the statistically significant differences to have occurred between the following evaluations, at p<0.01:
- Baseline to Treatment End
- Baseline to Follow-Up
- Treatment End to Follow-Up
Placebo Group: There is a statistically significant difference in HbA1c ratings across study evaluation duration for placebo group subjects (F=274.79, p<0.0001). Subsequent Tukey Analysis revealed the statistically significant differences to have occurred between the following evaluations, at p<0.01:
- Baseline to Follow-Up
- Treatment End to Follow-Up
In summary, similarly to the BMI findings, both active and placebo subject groups evidenced a decrease in HbA1c from pre-treatment to treatment end evaluation, although the decrease was only statistically significant for the active treatment group at p<0.01. However, while both groups evidenced statistically significant changes in HbA1c from treatment end to follow-up evaluation, this change was a statistically significant decrease for active group subjects and a statistically significant increase for placebo group subjects. By follow-up evaluation, active group subjects evidenced a statistically significant mean decrease
in HbA1c of 1.78 relative to baseline. In contrast, placebo group subjects evidenced a statistically significant mean increase in HbA1c of 3.10 across the same evaluation period.
Furthermore, while there was no difference in baseline (pre-treatment) HbA1c between active and placebo subject groups (both 6.46), the 4.88 difference in mean HbA1c between active and placebo groups at follow-up evaluation was statistically significant in favor of a significantly lower HbA1c for active group subjects relative to placebo group subjects (p<0.0001).
Total Cholesterol
| Total Cholesterol | Baseline | Follow-Up |
| Active Mean | 5.09 | 3.53 |
| SD | 1.65 | 0.50 |
| Placebo Mean | 5.62 | 5.76 |
| SD | 1.80 | 1.49 |
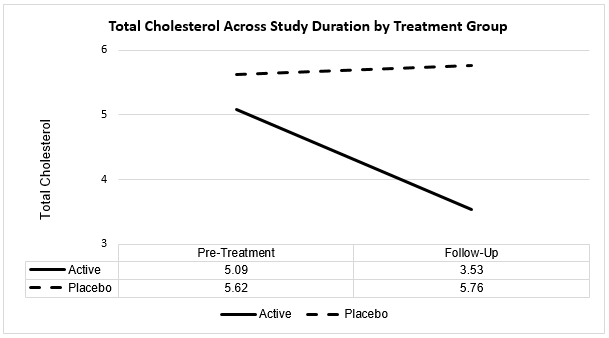
T-tests for correlated samples were conducted to evaluate change in total cholesterol across the study duration for each of the active and placebo treatment groups, with results as follows:
Active Group
T=10.11, p<0.0001. There is a statistically significant 1.56-point decrease in total cholesterol ratings from pre-treatment to treatment follow-up evaluation for active group subjects.
Placebo Group
There is no change in total cholesterol ratings from pre-treatment to follow-up evaluation for placebo group subjects (t=-1.32, p=0.19; p>0.05), with the 0.14-point increase being not statistically significant.
Furthermore, while there was no statistically significant difference in baseline (pre-treatment) total cholesterol between active and placebo subject groups (p>0.05), the 2.23-point difference in mean total cholesterol between active and placebo groups at follow-up evaluation was statistically significant (t=-11.89, p<0.0001).
Blood pressure
Blood pressure was recorded at baseline (pre-treatment), treatment end, and follow-up.
At baseline, blood pressure readings for all subjects in both the active and placebo groups were within the Hypertension Group 1 or Group 2 category.
Across treatment end and follow-up evaluations, all 70 subjects in the active treatment group demonstrated a progressive improvement (lowering) in blood pressure readings, and 12 active group subjects had lowered their blood pressure reading to within the pre-hypertension range by follow-up evaluation.
In contrast, there were no notable improvements in blood pressure readings for any of the 70 placebo group subjects from pre-treatment to follow-up evaluation, and no placebo group subject recorded a blood pressure rating below the Hypertension Stage 1 category at follow-up evaluation.
Sleep quality: P, A, I, G, E.
The P, A, I, G, E sleep quality scale used in this study is provided below.
P = You take more than 30 minutes to fall asleep after you get into bed.
You regularly wake up more than once per night.
You lie awake for more than 20 minutes when you wake up in the middle of the
night.
Feel tired quickly upon wakening.
A = You take less than 30 minutes to fall asleep after you get into bed.
You wake no more than once per night.
Your sleep is restless and your bed is tossed when you awaken.
Feel tired midday.
I = You take less than 20 minutes to fall asleep after you get into bed.
You wake no more than once per night.
You return to sleep quickly but sleep light.
Feel tired in the afternoon.
G = You fall asleep quickly after you get into bed.
You wake occasionally in the night.
You return to sleep quickly if you do awaken.
You seldom feel tired in the day.
E = You fall asleep quickly after you get into bed.
You do not wake in the night.
You awaken naturally and feel refreshed.
You never feel tired in the day.
Therefore, progression from ‘P’ through ‘E’ represents improvement in sleep quality.
Below is a summary of the percentage of subjects in each of the active and placebo groups, respectively, who rated their sleep quality on this scale as ‘P’, ‘A’, ‘I’, ‘G, or ‘E’ at each of the three evaluations.
| Active Group | Baseline | Treatment End | Follow-up |
| P | 30 (43%) | – | 1 (1%) |
| A | 29 (41%) | 12 (17%) | – |
| I | – | 37 (53%) | 9 (13%) |
| G | 11 (16%) | 12 (17%) | 13 (19%) |
| E | – | 9 (13%) | 47 (67%) |
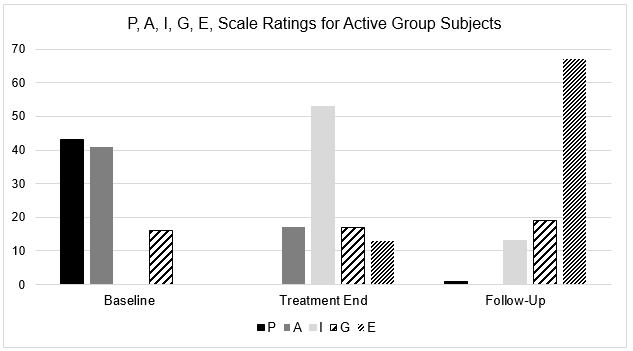
At basepoint evaluation, eighty-four per cent (84%) of active group subjects rated their sleep quality as ‘P’ or ‘A’ – the two poorest sleep quality categories. By Follow-Up evaluation, only one active group subject reported poor sleep quality, and each of the remaining active group subjects indicated improved sleep quality, with 86% of active group subjects reporting their sleep quality as ‘G’ or ‘E’ – the two best sleep quality categories.
| Placebo Group | Baseline | Treatment End | Follow-up |
| P | 39 (56%) | 20 (29%) | 21 (31%) |
| A | 24 (34%) | 37 (53%) | 19 (28%) |
| I | – | 11 (16%) | 13 (19%) |
| G | 7 (10%) | 2 (2%) | 15 (22%) |
| E | – | – | – |
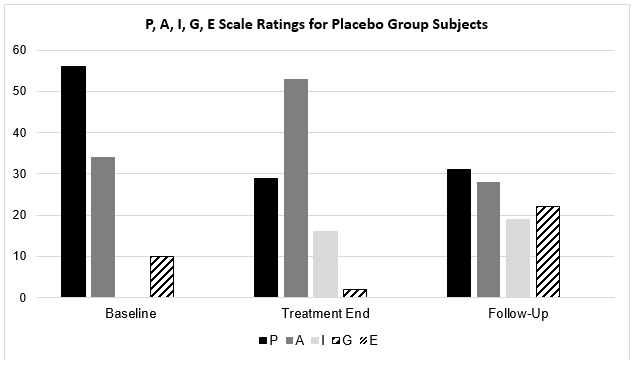
Similarly to active group subjects, 90% of placebo group subjects rated their sleep quality as ‘P’ or ‘A’ – the two poorest sleep quality categories – at baseline evaluation. However, by Follow-Up evaluation, 59% of placebo group subjects continued to record a ‘P’ or ‘A’ rating compared with the single active group subject, and only 22% of placebo group subjects reported their sleep quality as ‘G’ or ‘E’ – the two best sleep quality categories at follow-up evaluation compared with 86% of active group subject – almost four times fewer.
At the end of the 10 week active phase, all the subjects in the active protocol had undergone 4 weeks of further monitoring in relation to their blood glucose levels, and 69 of them no longer presented as a diabetes risk. The control group however all remained on the diabetes index as being at risk at week 10 +4. All subjects were encouraged to follow their established exercise routine and to foster their nutritional habits. Follow-ups were taken for 24 months.
In the control group 69 went on to develop diabetes and one died because of complications related to diabetes. Over time their weight increased. The female members of the group maintained reduced weight and cholesterol levels. All of the subjects continued with exercises and a reasonable diet.
Discussion
There is a growing body of research showing the benefits of NTLLL in the management of the human fat cell, pain management and neurological disorders but as yet there is no substantive research into the benefits of this technology in the management of obesity and diabetes. Weight contributed to rheumatoid arthritis, heart disease, osteoarthritis, is now a contributory factor in problems associated with the coronavirus. There are well recorded positive side effects associated with the use of NTLLL[i], and these effects need to be exploited. This is a simple inhouse study exploring the use of NTLLL at 635nm in pre-diabetes/pre-obese patients. Can we do anything to reduce the potential development of diabetes?
Conclusion
Diabetes is potentially a life limiting condition and fraught with many comorbidities. Patients may go on to develop issues with blood pressure, kidneys, neuropathies, and amputations. The list is practically endless. This study, though inhouse, has followed best practice in terms of RTC, and though it is not perfect, the evidence presented speaks for itself. NTLLL may have a place in the armament of treatments used to prevent and control what is one of the world’s biggest health issues. 65 out of 70 participants in the study who were pre-diabetic and pre-obese, and in a 10 week period, turned their lives around. Over a 5 year period they continued to improve and maintained the good habits they had formed on the study. They were no longer a diabetes risk and were not obese, and they all had good cholesterol levels and no blood pressure issues. They are no longer a burden on the healthcare systems. Although further studies are required, NTLLL could have long lasting benefits for diabetes, obesity, and health generally.
Reference:
- Scheen AJ. Pathophysiology of type 2 diabetes. Acta Clin Belg. 2003;58(6):335–341.
- van Belle TL, Coppieters KT, von Herrath MG. Type 1 diabetes: etiology, immunology, and therapeutic strategies. Physiol Rev. 2011;91(1):79–118.
- Al-Goblan, A. S., Al-Alfi, M. A., & Khan, M. Z. (2014). Mechanism linking diabetes mellitus and obesity. Diabetes, metabolic syndrome and obesity : targets and therapy, 7, 587–591. https://doi.org/10.2147/DMSO.S67400
- Baum JD, Ounsted M, Smith MA. Letter: Weight gain in infancy and subsequent development of diabetes mellitus in childhood. Lancet. 1975;2(7940):866.
- Naser KA, Gruber A, Thomson GA. The emerging pandemic of obesity and diabetes: are we doing enough to prevent a disaster? Int J Clin Pract. 2006;60(9):1093–1097.
- Gallagher D, Heymsfield SB, Heo M, Jebb SA, Murgatroyd PR, Sakamoto Y. Healthy percentage body fat ranges: an approach for developing guidelines based on body mass index. Am J Clin Nutr. 2000;72(3):694–701.
- Arora S. Insulin Resistance. Rijeka, Croatia: InTech Europe; 2012. [Accessed September 26, 2014]. Molecular basis of insulin resistance and its relation to metabolic syndrome.
- Tsai AG, Williamson DF, Glick HA. Direct medical cost of overweight and obesity in the USA: a quantitative systematic review. Obes Rev. 2011;12(1):50–61.
- McKeigue PM, Shah B, Marmot MG. Relation of central obesity and insulin resistance with high diabetes prevalence and cardiovascular risk in South Asians. Lancet. 1991;337(8738):382–386.
- https://www.who.int/health-topics/diabetes#tab=tab_1
- https://www.hsph.harvard.edu/news/press-releases/diabetes-cost-825-billion-a-year/
- Farivar, S., Malekshahabi, T., & Shiari, R. (2014). Biological effects of low level laser therapy. Journal of lasers in medical sciences, 5(2), 58–62.
